Year 1 Statistics · Chapter 6
Statistical Distributions
Specification: Edexcel Paper 3 §4.1 — Discrete distributions · AQA section N
In this chapter
Key facts — this chapter
- A discrete random variable takes separate values, each with a probability. Its probability distribution lists them, and the probabilities always sum to 1: .
- In a discrete uniform distribution every value is equally likely: .
- means a binomial distribution: fixed trials, two outcomes, constant probability of success, and independent trials.
- , using the from Chapter 7 of Pure.
- Cumulative probabilities: comes straight from a calculator. Then and .
- Check the four conditions before modelling anything as binomial.
A random variable is a quantity whose value depends on chance: the score on a die, the number of faulty items in a box. This chapter gives the language for describing all their probabilities at once, then studies the one distribution the course uses most.
1. Discrete random variables
A discrete random variable takes distinct, separate values. Capital letters name the variable and small letters its values, so means “the probability that takes the value 3”.
Key result
The probability distribution of gives for every value . Since one of them must happen,
Worked example 6.1 · Finding an unknown probability
The discrete random variable has the distribution below. Find , and then .
| 1 | 2 | 3 | 4 | |
|---|---|---|---|---|
The probabilities sum to 1:
Then .
A discrete uniform distribution is the simplest case: every value equally likely. A fair six-sided die gives for .
2. The binomial distribution
Many situations count successes in a fixed number of attempts: heads in 20 tosses, faulty bulbs in a box of 50. All of them share the same four features.
The binomial conditions
needs:
- a fixed number of trials, ;
- two outcomes per trial — success or failure;
- a constant probability of success, ;
- independent trials.
Then counts the successes, and takes values .
Common mistake
Sampling without replacement breaks conditions 3 and 4: taking one red ball out changes the chance for the next. A binomial model is only reasonable there if the population is very large compared with the sample, so the probability barely moves.
The binomial formula
for .
The counts the orders in which successes can happen — exactly the coefficient from Pascal’s triangle in Chapter 7 of Pure. The and give the probability of any one such order.
Worked example 6.2 · Using the formula
A biased coin lands heads with probability 0.3. It is tossed 10 times. Find the probability of exactly 4 heads.
Let be the number of heads, so :
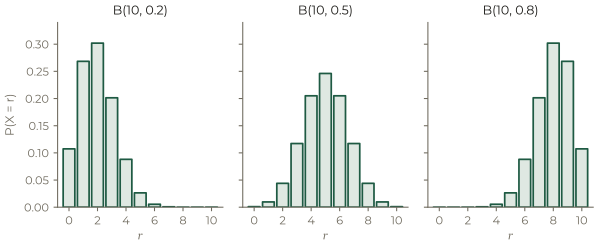
Set n and p, then choose the kind of probability you want. The bars that count towards it are shaded, and the total is written out as a calculator would give it.
3. Cumulative probabilities
Adding many separate terms is slow, so questions use cumulative probabilities — the total of all the bars up to .
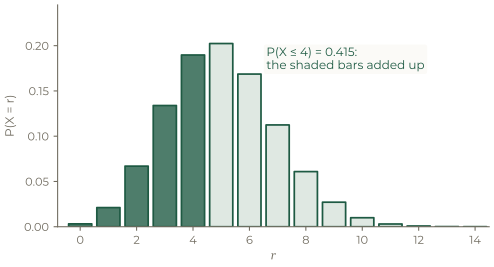
Key result
The matters: only takes whole-number values, so “at least 7” is “more than 6”.
On your calculator
Use the binomial probability distribution function for and the binomial cumulative distribution function for . Both need , and . Write the probability statement down before you reach for the calculator: most lost marks here are translation errors, not arithmetic.
Worked example 6.3 · Cumulative probabilities
. Find (a) , (b) , (c) .
(a) Straight from the cumulative function: .
(b) “At least 7” is “more than 6”:
(c) Subtract everything below 4, which is everything up to 3:
Common mistake
. That subtracts the bar as well. Sketch the bars if you’re unsure which end points belong in the range.
4. Choosing the model
Exam questions often ask you to justify a binomial model, or to criticise one.
Worked example 6.4 · Is a binomial model reasonable?
A teacher says the number of students, out of 30 in a class, who are late on a given morning can be modelled as . Comment on this model.
There are a fixed number of students (30), and each is either late or not, so conditions 1 and 2 hold.
The model assumes every student has the same probability of being late (0.1), and that they are independent. Neither is likely: some students travel further and are late more often, and students who share a bus will be late together, so one being late makes another more likely.
In context
The binomial model is a reasonable first approximation, but it will understate the chance of several students being late at once, because lateness tends to come in clusters.
Practice
Twelve questions in three tiers. Try each one properly before opening the solution. Give probabilities to 3 significant figures unless they are exact, and always define your variable — “let be the number of…” — before using a binomial model.
Warm-up
The discrete random variable has the distribution shown.
| 1 | 2 | 3 | |
|---|---|---|---|
- Find .
- Find .
Show solution
(a) , so .
(b) .
. Find
- ;
- .
Show solution
(a) (3 s.f.).
(b) (3 s.f.).
A fair coin is tossed 12 times. Let be the number of heads.
- State the distribution of .
- Find and .
Show solution
(a) .
(b) and (both 3 s.f.).
State the four conditions needed for a binomial model, and say which one fails when three cards are dealt from a pack and is the number of aces.
Show solution
A fixed number of trials; two outcomes per trial; a constant probability of success; independent trials.
Dealing without replacement breaks the constant probability (and the independence): once an ace has gone, the chance that the next card is an ace falls from to .
Standard
A factory’s components are faulty with probability 0.07, independently of each other. A sample of 50 is tested. Let be the number of faulty components.
- State the distribution of .
- Find .
- Find .
- Find the probability that at least 5 are faulty.
Show solution
(a) .
(b) (3 s.f.).
(c) (3 s.f.).
(d) (3 s.f.).
. Find
- ;
- ;
- ;
- .
Show solution
(a) 0.206 (3 s.f.).
(b) 0.722 (3 s.f.).
(c) (3 s.f.).
(d) (3 s.f.).
A fair six-sided die is rolled 10 times. Let be the number of sixes.
- State the distribution of and justify the binomial conditions.
- Find the probability of exactly two sixes.
- Find the probability of at least one six.
Show solution
(a) : 10 fixed rolls, each a six or not, the probability stays every time, and the rolls are independent.
(b) (3 s.f.).
(c) (3 s.f.).
For each situation, state whether a binomial model is reasonable, and why.
- The number of heads when a fair coin is tossed 50 times.
- The number of rainy days in a week in one town.
- The number of red beads when 5 beads are taken, without replacement, from a bag of 8 red and 7 blue.
Show solution
(a) Reasonable: 50 fixed trials, two outcomes, constant , independent tosses.
(b) Not reasonable: the weather on consecutive days is not independent — wet days cluster — and the probability of rain is not the same every day of the year.
(c) Not reasonable: without replacement from a small bag, the probability changes sharply with each bead taken, so is not constant.
Exam style
A company knows that 40% of visitors to its website buy something. On a particular day, 25 visitors are chosen at random. Let be the number who buy something.
- State the distribution of , and one assumption needed.
- Find .
- Find .
- Find the probability that at least 12 of them buy something.
- Find .
Show solution
(a) , assuming the visitors buy independently of each other and each has the same probability 0.4 of buying.
(b) (3 s.f.).
(c) (3 s.f.).
(d) (3 s.f.).
(e) (3 s.f.).
A seed supplier claims that 90% of its seeds germinate. A gardener plants 20 seeds.
- Assuming the claim is correct, find the probability that all 20 germinate.
- Find the probability that at least 18 germinate.
- Only 14 of the gardener’s seeds germinate. Without doing a formal test, comment on the supplier’s claim.
Show solution
Let be the number that germinate, so .
(a) (3 s.f.).
(b) (3 s.f.).
(c) If the claim were true, you would expect about 18 seeds to germinate, and getting as few as 14 is unlikely. This is evidence against the claim, though one gardener’s results could be affected by soil or watering rather than the seeds. (Chapter 7 makes this judgement precise.)
.
- Write out the full probability distribution of , giving each probability to 4 decimal places.
- Verify that the probabilities sum to 1.
- State the most likely value of .
Show solution
(a)
| 0 | 1 | 2 | 3 | 4 | |
|---|---|---|---|---|---|
| 0.3164 | 0.4219 | 0.2109 | 0.0469 | 0.0039 |
(b) .
(c) is the most likely value, with probability 0.4219.
In a large population, 5% of people carry a particular gene. A researcher tests 30 people chosen at random. Let be the number of carriers.
- Explain why a binomial model is reasonable here, even though the sampling is without replacement.
- Find the probability that none of the 30 carries the gene.
- Find the probability that at least 3 carry it.
- The researcher finds 6 carriers. Suggest what this might indicate.
Show solution
(a) The population is very large, so removing 30 people barely changes the proportion of carriers. The probability stays effectively 0.05 for each person, and the results are effectively independent.
(b) , so (3 s.f.).
(c) (3 s.f.).
(d) With you would expect about 1 or 2 carriers in 30, so 6 is far more than expected. It suggests the true proportion in this population may be higher than 5%, or that the sample was not random — perhaps the people tested were related, or selected because of a family history.