Year 1 Statistics · Chapter 7
Hypothesis Testing
Specification: Edexcel Paper 3 §5.1–5.2 — Hypothesis testing · AQA section O
In this chapter
Key facts — this chapter
- A hypothesis test asks whether a sample gives enough evidence to reject a claim about a population proportion .
- (null) always says equals a stated value. (alternative) says , (one-tailed) or (two-tailed) that value.
- Assume is true, so the test statistic , and ask how likely the observed result, or something more extreme, is.
- p-value method: if , reject . For a two-tailed test at , compare each tail with .
- Critical region: the set of values that would lead to rejecting . Its total probability must not exceed (or per tail).
- The actual significance level is the true probability of the critical region, which is usually less than because is discrete.
- Always finish in context, and never claim is proved.
Chapter 6 asked “given , how likely is this result?” This chapter turns the question round: given a result, is it strange enough to doubt the claimed ? The answer is never certainty — it is a judgement, made with a stated risk of being wrong.
1. The language
Setting up a test
- Define the variable and the parameter: “let be the proportion of …” and “let be the number of …”.
- State the hypotheses, both about : against , or .
- State the test statistic and its distribution assuming : .
- State the significance level (usually 5%, 10% or 1%).
The alternative hypothesis comes from the question. “Is the coin biased towards heads?” is one-tailed (). “Is the coin biased?” is two-tailed ().
Common mistake
Hypotheses are about the population proportion , never about the sample. Writing or ”: the coin is fair” without the symbols loses marks. And always has an equals sign.
2. The p-value method
Assume . Work out the probability of the observed result, or anything more extreme in the direction of . That probability is the p-value.
Key result
For a two-tailed test at level , compare the one tail you are in with .
Worked example 7.1 · A one-tailed test
A coin is tossed 20 times and lands heads 15 times. Test, at the 5% level, whether the coin is biased towards heads.
Let be the probability of heads and the number of heads in 20 tosses.
Assuming , . The observed value is 15, and “more extreme” means more heads:
Since , the result is significant: reject .
In context
There is sufficient evidence at the 5% level to suggest that the coin is biased towards heads.
Common mistake
is not the p-value. A test asks how unusual the result is, so it must include everything at least as extreme: .
3. Critical regions
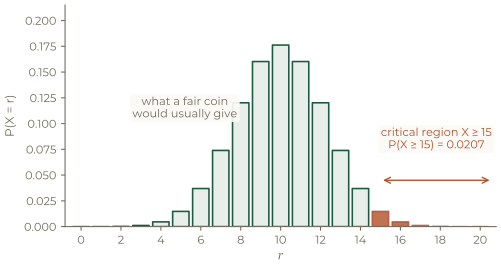
Instead of testing one result, you can work out in advance which results would lead to rejection. That set is the critical region.
Key result
The critical region is the set of values of the test statistic for which is rejected. Choose it so its probability is at most (or in each tail of a two-tailed test).
The critical value is the first value inside the region, and everything else is the acceptance region.
Worked example 7.2 · Finding a critical region
Find the critical region for a one-tailed test of against at the 5% level, using , and state the actual significance level.
Work down from the top until the tail first drops below 5%:
So the critical region is , and the critical value is 15.
In context
The actual significance level is 0.0207, or 2.07%: because is discrete, no region has probability exactly 5%, so the test is more cautious than 5% suggests.
The distribution of the test statistic assuming H₀ is true. Change the significance level and watch the critical region grow one bar at a time — and see how far its true probability sits below the level you asked for. Then drop in an observed value.
4. Two-tailed tests
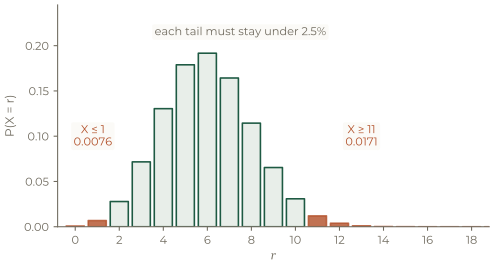
A two-tailed test asks whether has changed in either direction, so the significance level is split between the two tails.
Worked example 7.3 · A two-tailed test
A machine is claimed to produce faulty items 30% of the time. In a sample of 20 items, 2 are faulty. Test at the 5% level whether the rate has changed.
Let be the proportion of faulty items and the number faulty in 20.
Assuming , . The observation, 2, is low, so use the lower tail and compare with :
The result is not significant: do not reject .
In context
There is insufficient evidence at the 5% level to suggest that the rate of faulty items has changed from 30%.
Why the same number can pass one test and fail another
is below 5% but above 2.5%. So 2 faulty items would be significant in a one-tailed test of , but is not significant in a two-tailed test at the same level. Asking a vaguer question (“has it changed?”) demands stronger evidence, which is why the tails must be decided before you see the data.
Common mistake
Don’t halve the p-value; halve the significance level. And never choose the direction of after seeing which way the data went — that quietly doubles your chance of a false positive.
5. Writing the conclusion
Every test ends with two sentences: a statistical one and a contextual one.
The two-sentence ending
- “The result is significant / not significant at the % level, so reject / do not reject .”
- “There is sufficient / insufficient evidence at the % level to suggest that …” — in the words of the question.
Common mistake
Never write ” is true” or “the coin is fair”. Failing to reject only means this sample wasn’t unusual enough — which is not the same as proof. Keep the hedged wording: insufficient evidence to suggest.
In context
A 5% significance level means that, even when is true, about 1 test in 20 will reject it by chance. That is the risk you accept when you choose .
Practice
Twelve questions in three tiers. Try each one properly before opening the solution. Every test needs the same skeleton: define and , state and , state the distribution under , compare with the significance level, and finish in context.
Warm-up
under . An experiment gives , and .
- Write down the probability needed for the test.
- Find it, and state whether the result is significant at the 5% level.
Show solution
(a) — the observed value or anything more extreme.
(b) . Since , the result is not significant at the 5% level.
Under , , and . The observed value is 2. Find the p-value and test at the 5% level.
Show solution
. Since , the result is significant: reject .
Find the critical region for a one-tailed test of against at the 5% level, using , and state the actual significance level.
Show solution
and .
The critical region is , and the actual significance level is 0.0338, or 3.38%.
For each situation, state and , and whether the test is one- or two-tailed.
- A manufacturer claims 20% of its sweets are red; a shopper thinks there are fewer.
- A drug is known to work for 60% of patients; a researcher asks whether a new version has a different success rate.
Show solution
(a) , . One-tailed.
(b) , . Two-tailed.
Standard
A coin is tossed 25 times and lands heads 18 times. Test at the 5% level whether the coin is biased towards heads.
Show solution
Let be the probability of heads and the number of heads in 25 tosses.
, . Assuming , .
Since , reject .
In context
There is sufficient evidence at the 5% level to suggest that the coin is biased towards heads.
A garage claims that 15% of cars fail their first MOT. An inspector checks 40 cars and finds 2 failures. Test at the 1% level whether the failure rate is lower than claimed.
Show solution
Let be the proportion of cars that fail and the number failing out of 40.
, . Assuming , .
Since , do not reject .
In context
There is insufficient evidence at the 1% level to suggest that the failure rate is lower than 15%. (At the 5% level the same data would have been significant, which shows how much the chosen level matters.)
under , tested against at the 10% level.
- Find the critical region.
- Find the actual significance level of the test.
Show solution
(a) Each tail must stay under 5%.
Lower: but , so the lower part is .
Upper: but , so the upper part is .
The critical region is or .
(b) , so the actual significance level is 6.52%.
Explain, in the context of a hypothesis test:
- what the significance level means;
- why “do not reject ” is not the same as ” is true”;
- why the actual significance level is usually less than the stated one.
Show solution
(a) It is the probability of rejecting when is actually true — the risk of a false positive you are willing to accept. At 5%, about 1 test in 20 would reject a true by chance.
(b) The test only asks whether the data are unusual enough. A result inside the acceptance region is consistent with , but it is also consistent with values of close to , so nothing is proved.
(c) The test statistic is discrete, so the tail probabilities jump in steps. The critical region is the largest tail whose probability stays at or below the stated level, and that is normally some way below it.
Exam style
A seed company claims that 10% of its seeds fail to germinate. A gardener plants 50 seeds and 9 fail.
- Test at the 5% level whether the failure rate is higher than claimed.
- Find the critical region for this test, and state the actual significance level.
- Explain how your answers to (a) and (b) are consistent.
Show solution
(a) Let be the proportion that fail and the number failing out of 50.
, . Assuming , .
Since , do not reject : there is insufficient evidence at the 5% level that more than 10% of seeds fail.
(b) and , so the critical region is , with actual significance level 2.45%.
(c) The observed value 9 is not in the critical region , which matches the p-value conclusion: both say the evidence is not strong enough. Nine failures is unlucky but not rare enough to doubt the claim.
A revision app claims that 70% of its users improve their grade. A school tries it with 30 students, and 16 improve. Test at the 5% level whether the app’s claim is too high.
Show solution
Let be the proportion of users who improve and the number improving out of 30.
, . Assuming , .
Since , reject .
In context
There is sufficient evidence at the 5% level to suggest that fewer than 70% of users improve their grade, so the app’s claim looks too high. (The school’s students may not be typical users, so the conclusion applies to this population.)
A spinner is supposed to land on red one third of the time. It is spun 24 times and lands on red 14 times. A student tests at the 5% level whether the spinner is fair.
- State the hypotheses and explain why the test is two-tailed.
- Find the critical region and the actual significance level.
- Carry out the test using the p-value method, and show it agrees with the critical region.
Show solution
(a) Let be the probability of red and the number of reds in 24 spins. , . The question asks whether the spinner is fair, not whether it favours red, so a change in either direction matters.
(b) Each tail must stay under 2.5%. Assuming , .
Lower: , while , so .
Upper: , while , so .
The critical region is or , and the actual significance level is , or 3.02%.
(c) The observed value is high, so use the upper tail: . Since , reject . The value 14 also lies in the critical region , so the two methods agree.
In context
There is sufficient evidence at the 5% level to suggest that the spinner does not land on red one third of the time.
A student tosses a coin 12 times, gets 10 heads, and writes: ”, which is less than 0.05, so the coin is biased towards heads.”
- The student had planned to test whether the coin was biased in either direction. Redo the comparison properly and state the conclusion.
- Give two criticisms of the student’s written conclusion.
- Explain why choosing the tail after seeing the data is poor practice.
Show solution
(a) For a two-tailed test at 5%, compare the upper tail with . Since , the result is significant, so reject : there is sufficient evidence at the 5% level that the coin is biased.
(Equivalently, the two-tailed p-value is .)
(b) First, the conclusion claims the coin is biased, when a test only gives evidence; it should say “there is sufficient evidence to suggest”. Second, the student compared a one-tailed probability with the full 5% even though the planned test was two-tailed.
(c) Choosing the direction after seeing the data means you would have tested the lower tail had the result gone the other way. That gives two chances to find significance, so the real false-positive rate is about double the stated level.