Year 1 Statistics · Chapter 1
Data Collection
Specification: Edexcel Paper 3 §1.1 — Statistical sampling · AQA section K
In this chapter
Key facts — this chapter
- The population is everything you want to know about. A census measures every member of it. A sample measures some of them.
- A sampling frame is a list of the population that a sample can be drawn from.
- Random methods (simple random, systematic, stratified) give every member a known chance of selection. Non-random methods (quota, opportunity) are quicker but open to bias.
- Stratified: sample each group in proportion to its size, taking from each.
- Different samples give different results. Larger random samples tend to give more reliable estimates, but no sample size fixes a biased method.
- Data are qualitative (words) or quantitative (numbers); quantitative data are discrete (counted) or continuous (measured).
Statistics starts before any calculation: with the question of where the data came from. A beautifully calculated mean is worthless if the sample behind it was lopsided. This chapter is about collecting data well, and about spotting when someone else hasn’t.
1. Populations and samples
Key result
- The population is the whole set of items of interest: every student in a school, every light bulb a factory makes today.
- A census observes or measures every member of the population.
- A sample is a selection of members, used to learn about the population.
- The sampling units are the individual members that can be sampled, and the sampling frame is a list of all of them.
| Advantages | Disadvantages | |
|---|---|---|
| Census | completely accurate picture of the population | slow and expensive; a lot of data to process; impossible when testing destroys the item |
| Sample | quicker, cheaper, less data to process | may not represent the population; different samples give different results |
Using a sample to say something about the whole population is called informal inference. It’s what almost every statistic in the news is doing.
Common mistake
“Testing destroys the item” is the classic reason a census is impossible. You can’t test the lifetime of every light bulb, or there would be none left to sell. Give that kind of reason, tied to the context, rather than a vague “it takes too long”.
2. Random sampling methods
In a random method, every member of the population has a known, non-zero chance of being chosen. That protects the sample from the choices of whoever is collecting the data.
Simple random sampling
Every sample of the chosen size is equally likely. Number the sampling frame, then use a random number generator (or a lottery) to pick numbers, ignoring any repeats, until you have enough.
Systematic sampling
Choose every th member of an ordered list, where . Start at a random member among the first . (A method named in Edexcel’s guidance.)
For a sample of 40 from a list of 600, . Pick a random start from 1 to 15, say 7. Then take members 7, 22, 37, 52, and so on.
Stratified sampling
Split the population into groups called strata (year groups, age bands, shifts), then take a simple random sample from each group, in proportion to its size. (Also named in Edexcel’s guidance.)
Stratified sampling
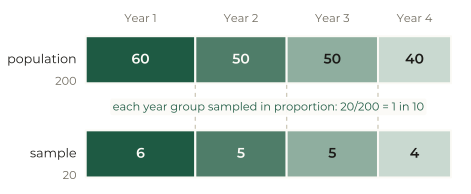
Worked example 1.1 · A stratified sample
A factory runs three shifts with 120, 90 and 150 workers. The manager wants a stratified sample of 24 workers. How many should be taken from each shift, and how should they then be chosen?
There are workers in total, so each shift contributes :
Within each shift, number the workers and use a random number generator to choose 8, 6 and 10 of them respectively.
In context
Sampling by shift makes sure the views of every shift are represented in their true proportions. A simple random sample could, by chance, draw mostly from one shift.
3. Non-random methods
Sometimes there is no sampling frame, or no time to use one. Then the collector chooses the sample, which is quicker but lets bias in.
- Quota sampling: the collector is told how many of each type of person to include (for example 20 men and 20 women over 60) and fills each quota with whoever they meet. It mirrors the population’s make-up without needing a list. (Named in Edexcel’s guidance.)
- Opportunity (convenience) sampling: take whoever is available at the time, such as the first 30 people through a door. It’s easy and cheap, but it is unlikely to be representative.
Choosing a method
| Method | Needs a sampling frame? | Main advantage | Main disadvantage |
|---|---|---|---|
| Simple random | yes | free from the collector’s bias | needs a full list; can miss small groups by chance |
| Systematic | yes (ordered) | quick and simple to use | biased if the list has a repeating pattern |
| Stratified | yes, split into strata | reflects the population’s structure | the strata must be known and clearly defined |
| Quota | no | quick; mirrors the population’s make-up | the collector chooses, so it can be biased |
| Opportunity | no | easiest and cheapest | unlikely to represent the population |
Common mistake
“Random” does not mean “haphazard”. Picking people you feel are random, like stopping whoever looks friendly, is opportunity sampling, with all its bias. A method is only random if a random number generator (or similar) makes the choice.
4. Different samples, different conclusions
Two random samples from the same population almost never give exactly the same result. That variation is not a mistake. It’s the price of looking at part of the population instead of the whole. Two principles follow:
- Larger random samples vary less from one to the next, so their results are more reliable.
- A biased method gives results that are off in a consistent direction, and a bigger sample doesn’t cure that. It just gives the same wrong answer more confidently.
Each dot is a student; each has a (hidden) number of hours of sleep. Choose a method and a sample size, then draw samples again and again. Every sample mean lands on the line below, next to the true population mean.
Try the opportunity method in the explorer. The sample means cluster tightly, but around the wrong value, because the students nearest the door are mostly in one year group. The random methods scatter a little more but centre on the truth.
5. Types of data
Key result
- Qualitative data are descriptions: eye colour, favourite sport.
- Quantitative data are numbers. They are discrete if they can only take particular values, usually counts (number of siblings, shoe size), and continuous if they are measured on a scale (time, height, mass).
Large sets of continuous data are usually grouped into classes. If times are recorded to the nearest second, the class “10–14” really holds every time from 9.5 s up to (but not including) 14.5 s. So:
- the class boundaries are 9.5 and 14.5;
- the class width is ;
- the midpoint is .
The midpoint stands in for every value in the class when you estimate a mean from grouped data, which is Chapter 2’s job.
Common mistake
The boundaries depend on how the data were recorded. Ages are the exception: “age 10–14” means from the 10th birthday up to (but not including) the 15th, so the boundaries are 10 and 15, not 9.5 and 14.5.
Practice
Twelve questions in three tiers. Try each one properly before opening the solution. Many statistics marks are for explanation, so the solutions give model answers: say what the method does, then tie it to the context.
Warm-up
A council wants to know how residents of a town travel to work.
- Describe the population.
- Give one advantage and one disadvantage of taking a census rather than a sample.
Show solution
(a) Every resident of the town who travels to work.
(b) Advantage: a census gives a complete, accurate picture of how everyone travels. Disadvantage: surveying every working resident would be slow and expensive, and would produce a lot of data to process.
Classify each type of data as qualitative, discrete or continuous:
- the number of siblings a student has;
- a person’s eye colour;
- the time taken to run 100 m;
- a shoe size.
Show solution
(a) Discrete (a count). (b) Qualitative. (c) Continuous (measured). (d) Discrete: shoe sizes go up in fixed steps (half sizes), so they can only take particular values.
A sixth-form college has 180 students studying science, 120 studying humanities and 60 studying languages. A stratified sample of 30 students is taken. How many should come from each group?
Show solution
The total is .
Science: . Humanities: . Languages: .
A club has an alphabetical list of 800 members. Describe how to take a systematic sample of 50 of them.
Show solution
The interval is . Choose a random starting point from the first 16 names (say the 9th), using a random number generator. Then take every 16th name after it: the 9th, 25th, 41st, and so on, until 50 members are chosen.
Standard
A supermarket manager wants to know whether customers would like longer opening hours. She asks the first 40 customers who enter the shop at 10 a.m. on a Tuesday.
- Name this sampling method.
- Explain why the sample is likely to be biased.
- Suggest a better method.
Show solution
(a) Opportunity (convenience) sampling.
(b) Customers who shop at 10 a.m. on a weekday are unlikely to include people who work during the day. Those are exactly the people most likely to want longer hours, so their views will be under-represented.
(c) Sample customers across different days and times, for example a quota sample with quotas for weekday mornings, evenings and weekends. Or, if there is a list of loyalty-card holders, take a simple random sample from it.
A company has 450 employees. Describe how to take a simple random sample of 30 of them.
Show solution
Obtain a list of all 450 employees (the sampling frame) and number them 1 to 450. Use a random number generator to generate numbers between 1 and 450, ignoring any repeats, until 30 different numbers have been chosen. The employees with those numbers form the sample.
A market researcher must interview 100 adults about a new product, in the same proportions of age groups as the local population.
- Explain how a quota sample could do this.
- Give one advantage and one disadvantage of quota sampling compared with stratified sampling.
Show solution
(a) Work out how many of the 100 should come from each age group, using the population proportions. The researcher then interviews people in the street until each age group’s quota is filled.
(b) Advantage: no sampling frame is needed, so it’s quick and cheap to carry out. Disadvantage: the researcher chooses who to approach within each quota, so the sample is not random and can be biased. For example, they might approach only people who look approachable.
The times, to the nearest second, for 60 students to solve a puzzle are grouped in the classes 10–14, 15–19, 20–29 and 30–49.
- State the class boundaries of the class 20–29.
- Find the width and the midpoint of each class.
Show solution
(a) 19.5 and 29.5.
(b) Using the boundaries 9.5, 14.5, 19.5, 29.5 and 49.5:
| Class | 10–14 | 15–19 | 20–29 | 30–49 |
|---|---|---|---|---|
| Width | 5 | 5 | 10 | 20 |
| Midpoint | 12 | 17 | 24.5 | 39.5 |
Exam style
A town council wants the views of 60 residents about a new bus route. The town has four wards, with 2400, 1800, 3000 and 1800 residents.
- Explain why a stratified sample by ward would be suitable.
- Find the number of residents to sample from each ward.
- Explain how the residents within each ward should then be selected.
Show solution
(a) The route will affect the wards differently, so views may vary by ward. Stratifying makes sure every ward is represented in proportion to its population.
(b) Total . Numbers: , , , and again for the last ward.
(c) Using the electoral register for each ward as a sampling frame, number the residents and take a simple random sample of the required size with a random number generator.
Two students estimate the mean number of hours of sleep per night of the 1200 students in their school. Aisha takes a simple random sample of 10 students and gets a mean of 7.9 hours. Ben takes a simple random sample of 50 students and gets a mean of 8.3 hours.
- Explain why the two estimates are different.
- State, with a reason, which estimate is likely to be more reliable.
- Ben says his result proves the school mean is 8.3 hours. Comment on this.
Show solution
(a) They used different samples. Each sample contains different students, so the sample means vary by chance, even though both methods are random.
(b) Ben’s, because a larger random sample tends to vary less from the true population mean.
(c) It doesn’t prove it. His sample mean is only an estimate, and another sample of 50 would give a slightly different value. The school mean is probably close to 8.3 hours.
A factory has 10 machines. Their products come off one conveyor belt in turn: item 1 from machine 1, item 2 from machine 2, and so on, repeating every 10 items. An inspector checks every 10th item for faults.
- Name the sampling method and explain the problem with it here.
- Suggest how the inspector could improve the sample.
Show solution
(a) Systematic sampling. The list has a repeating pattern with the same period as the sampling interval, so every item checked comes from the same machine. Faults on the other nine machines would never be found.
(b) Stratify by machine: take a random sample of items from each machine. Or use an interval that doesn’t share a factor with 10 (such as every 7th item), so that every machine is visited.
A gym owner wants to estimate the average number of hours per week that adults in her town spend exercising. On a Saturday morning she asks 50 members at her gym.
- Identify the population she is interested in.
- Give two reasons why her sample is likely to be biased, and say what effect each would have on her estimate.
- Describe a better way to collect the data.
Show solution
(a) All adults living in the town.
(b) Gym members only: people who belong to a gym probably exercise more than average, so the estimate will be too high. Saturday morning: the people there at that time are likely to be the most frequent gym users, which pushes the estimate up further. (Her sampling frame is also wrong: gym members are not the town’s adult population.)
(c) Use a list of all adults in the town, such as the electoral register, and take a simple random sample, or a stratified sample by age group, since exercise habits vary with age.
In context
As designed, her survey would overestimate the town’s average exercise, and a larger sample from the same gym would not fix that.